This sample uses simple animation and UI-control chart Components to help you visualize annual sales erformance data.
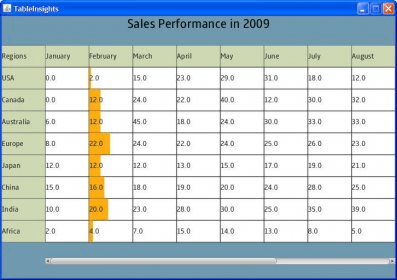
The TableInsights application displays a table of sales performance data for each month over one-year period for various regions. It uses the UI control ScrollView at the bottom to navigate left and right to view the data table.
The regional data for each month is displayed in rows and monthly data for each region is displayed in columns. As the mouse cursor hovers over a "region" or a "month." the numerical data is graphed by using the charting capabilities of JavaFX.
The data is visualized as bar graphs. When you click Regions at the upper-right corner conner cell, a line graphs that uses the LineChart component is displayed to visualize the performance data. This example demonstrates the ability of JavaFX to enhance visualization and to help interpret large amounts of data.
Comments